Burry's Dilution-Aware DCF Guide
The complete guide to adjusting the Gordon Growth Model for stock-based compensation dilution
12 min read
Prerequisites
- • CAPM Explained — Understanding the discount rate (d)
- • Owner's Earnings — Calculating true cash flow (CF₁)
The Gordon Growth Model (GGM) is the classic formula for valuing a perpetually growing stream of cash flows. It's simple, elegant, and widely used — but it has a critical flaw.
Traditional GGM Formula
Variables
- PV = Present Value (fair value per share)
- CF₁ = Next year's cash flow per share
- d = Discount rate (from CAPM)
- g = Perpetual growth rate
Key Constraint
d > gThe discount rate must exceed the growth rate, otherwise the formula produces negative or infinite values.
Example
A company with $5 per share cash flow, 10% discount rate, and 3% growth:
PV = $5 / (0.10 − 0.03) = $5 / 0.07 = $71.43The traditional GGM assumes your ownership percentage stays constant forever. But in reality, companies continuously issue new shares through stock-based compensation, diluting existing shareholders.
The Pie Analogy
Imagine you own 1% of a pie. The pie is growing at 5% per year (that's g). But the company is also giving away 2% of the pie to employees each year (that's y). Your slice is growing slower than you think — or even shrinking!
The Hidden Cost
Traditional GGM Assumes
- • Share count stays constant
- • Your ownership % never changes
- • All growth accrues to you
Reality
- • Share count grows 1-5% annually
- • Your ownership % shrinks
- • Some growth goes to new shareholders

Michael Burry's insight was to modify the GGM to account for perpetual dilution. When a company dilutes shareholders at rate y each year, the effective growth of per-share value is reduced.
Burry's Dilution-Aware Formula
Mathematical Derivation
The denominator can be expanded:
(1+d)(1+y) − (1+g) = 1 + d + y + dy − 1 − g = d + y + dy − gFor small values of d and y, the cross-term dy is negligible:
≈ d + y − gThis shows that dilution (y) effectively adds to the discount rate, reducing the present value.
Key Constraint
(1+d)(1+y) > (1+g)The combined effect of discount rate and dilution must exceed growth. If growth is too high relative to d+y, the model doesn't converge.
CF₁ — Cash Flow (Owner's Earnings)
The expected cash flow per share next year. BurryDCF uses Owner's Earnings — the TRUE cash flow after accounting for the real cost of SBC.
d — Discount Rate (CAPM)
The required rate of return, calculated using CAPM. Typically 8-15% for most stocks.
y — Dilution Rate
The annual rate at which share count is growing (dilution) or shrinking (buybacks).
- • Positive y: Dilution (shares increasing) — bad for shareholders
- • Negative y: Net buybacks (shares decreasing) — good for shareholders
- • Typical range: -5% to +5%
g — Growth Rate
The perpetual growth rate of cash flows. BurryDCF calculates this from historical Owner's Earnings growth (CAGR).
- • Should not exceed long-term GDP growth (~2-3%) for mature companies
- • High-growth companies may have higher g, but it will eventually decline
- • BurryDCF caps g at 30% to prevent unrealistic valuations
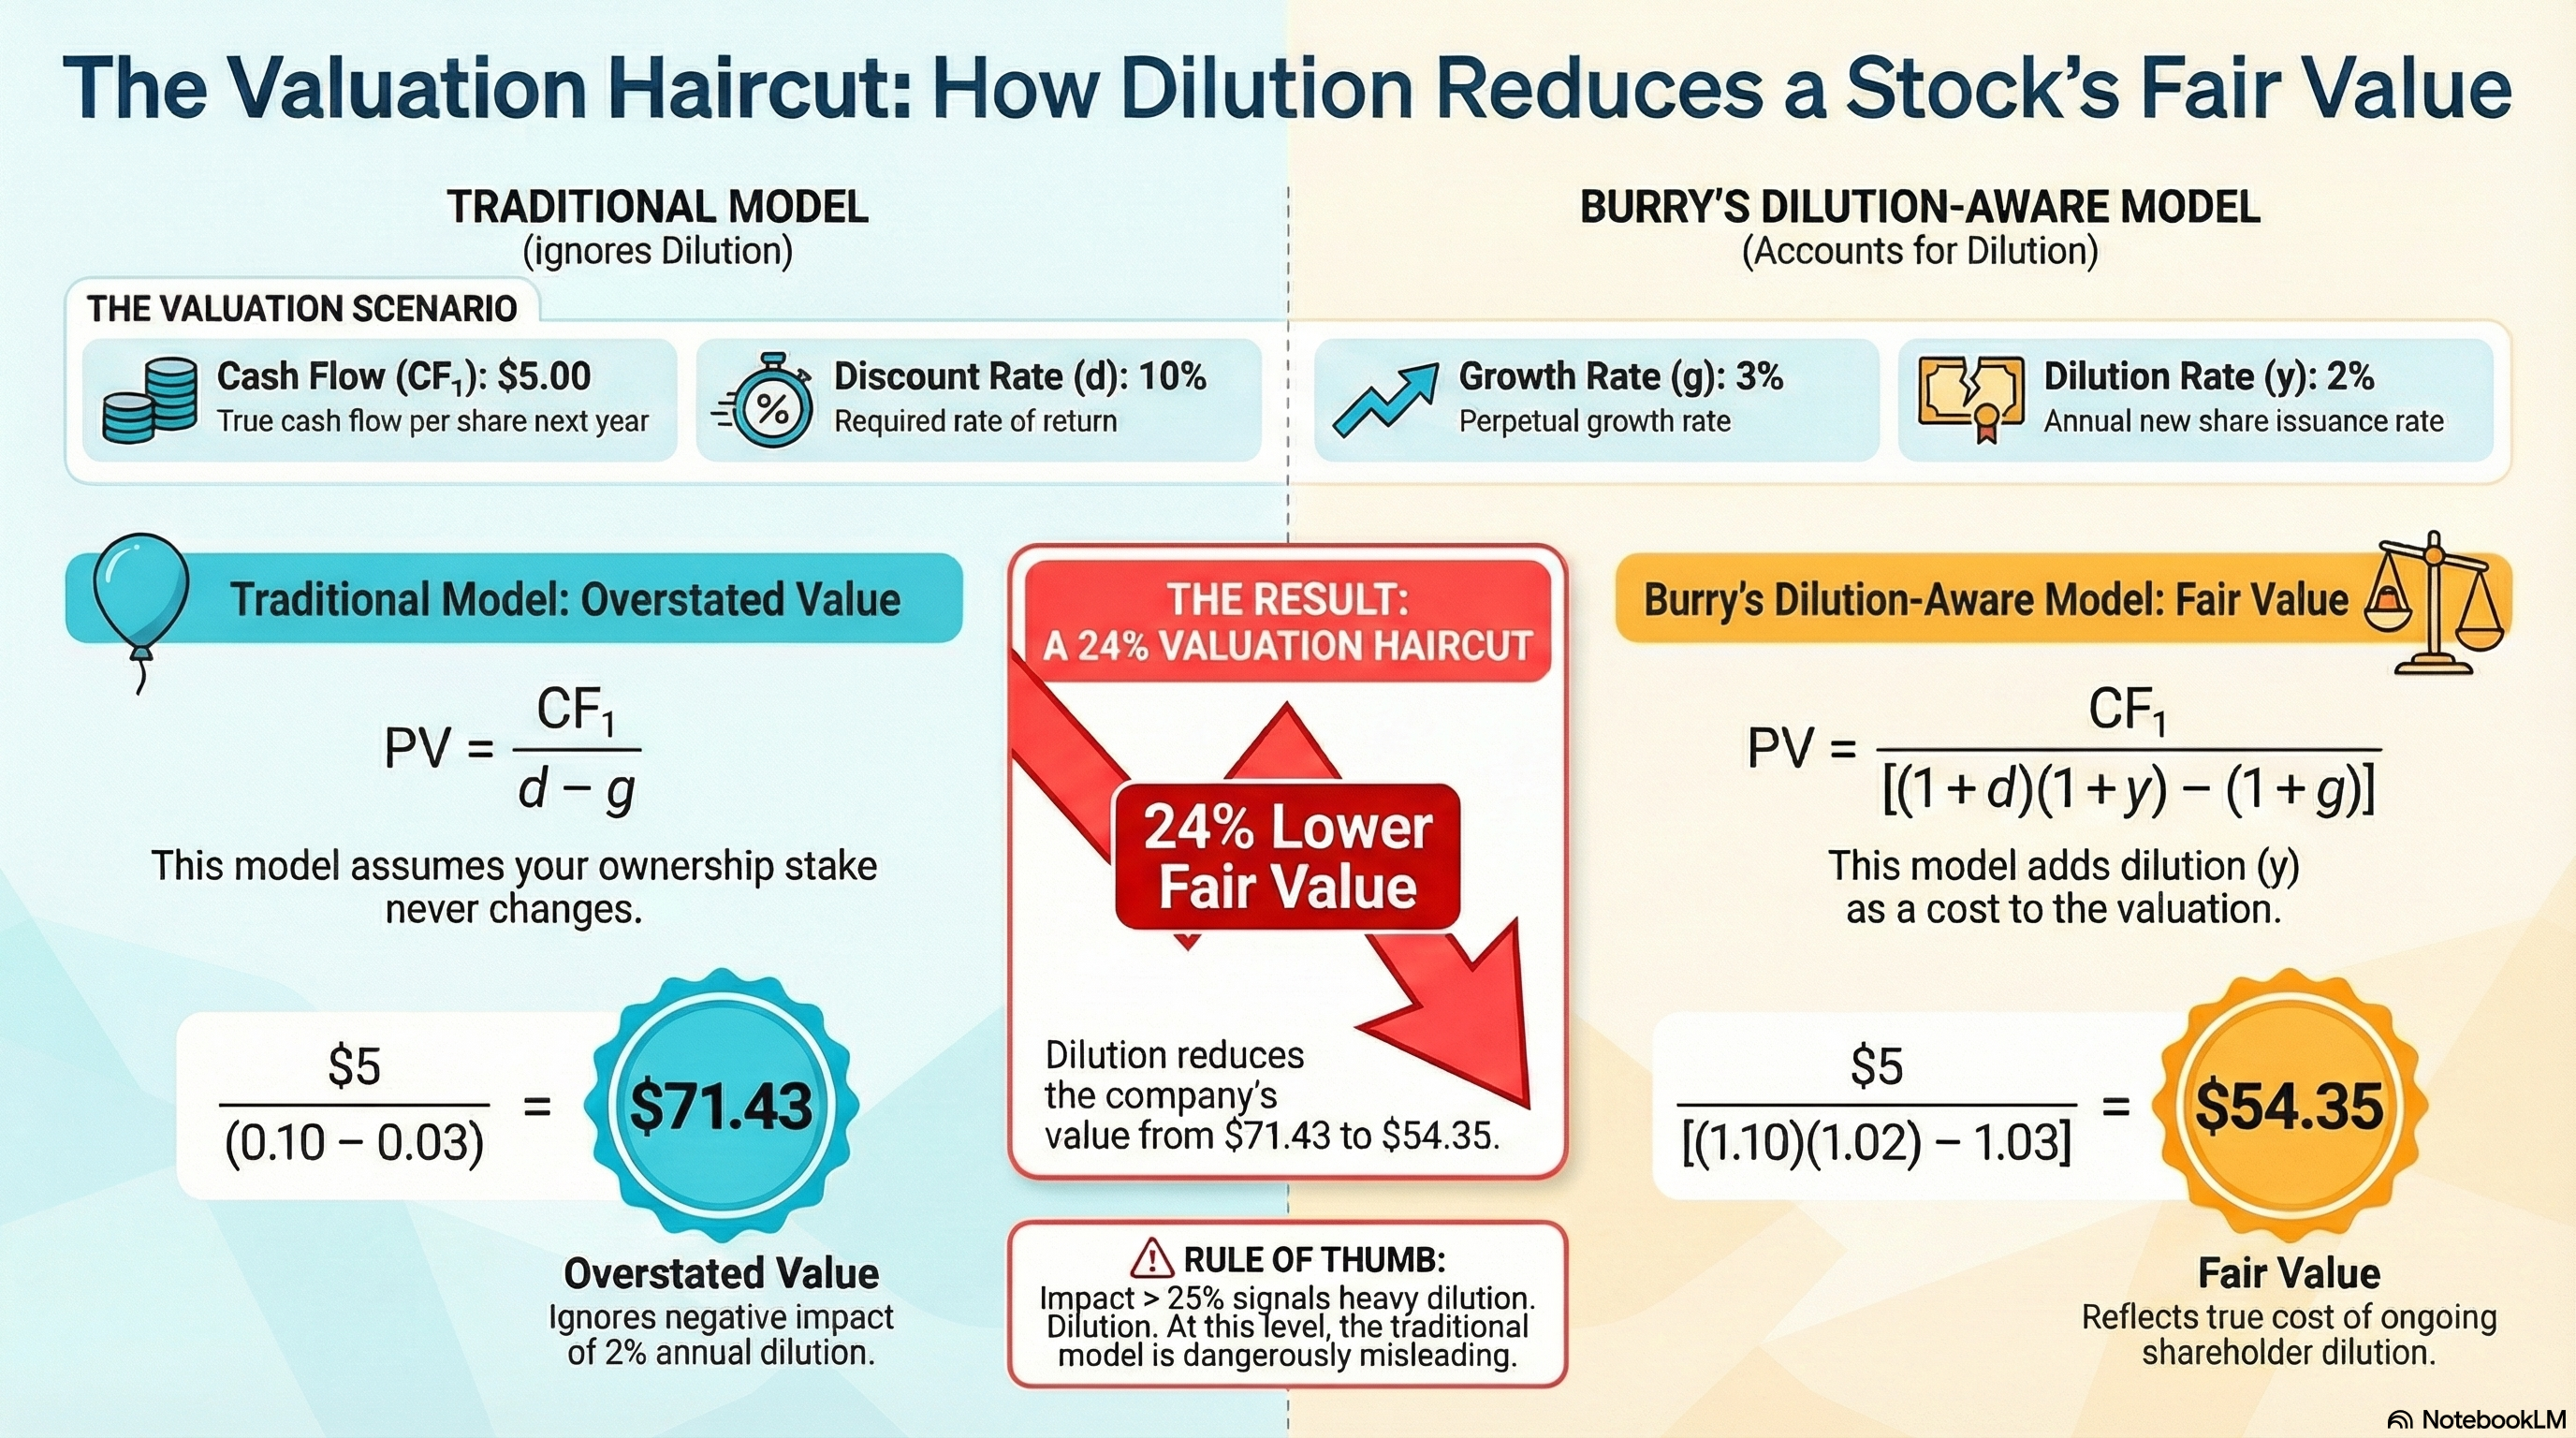
Let's compare both models using the same inputs to see the impact of dilution:
Inputs
- • CF₁ = $5.00 per share (Owner's Earnings)
- • d = 10% (discount rate from CAPM)
- • g = 3% (perpetual growth rate)
- • y = 2% (annual dilution rate)
Traditional GGM
PV = CF₁ / (d − g)
PV = $5 / (0.10 − 0.03)
PV = $5 / 0.07
PV = $71.43
Burry's Model
PV = CF₁ / [(1+d)(1+y) − (1+g)]
PV = $5 / [(1.10)(1.02) − 1.03]
PV = $5 / [1.122 − 1.03]
PV = $5 / 0.092
PV = $54.35
The Difference
The valuation haircut is the percentage difference between the traditional GGM fair value and Burry's dilution-aware fair value:
Haircut Formula
Minimal Impact
Low dilution or net buybacks — traditional GGM is reasonable
Moderate Impact
Significant dilution — use Burry's model for better accuracy
Major Impact
Heavy dilution — traditional GGM is dangerously misleading
Negative Haircut?
If a company has net buybacks (negative y), the Burry model will produce a higher fair value than traditional GGM. This is correct — buybacks increase per-share value by reducing share count.
The dilution-aware model is most valuable for companies with significant stock-based compensation programs:
Best For
- • High-growth tech companies (NVDA, TSLA, META)
- • Companies with heavy SBC programs
- • Startups and growth stocks
- • Any company with >1% annual dilution
Less Critical For
- • Mature dividend-paying companies
- • Companies with consistent buybacks
- • Low-SBC industries (utilities, REITs)
- • Companies with stable share counts
Pro Tip
Model Limitations
- • Perpetuity assumption: Real companies don't grow forever at a constant rate
- • Historical dilution: Past dilution may not predict future dilution
- • Growth rate uncertainty: g is inherently difficult to estimate
- • One input among many: Use alongside other valuation methods
CAPM Explained
Understand how to calculate the discount rate (d) using the Capital Asset Pricing Model.
← Read articleOwner's Earnings
Learn how to calculate true cash flow (CF₁) using Michael Burry's methodology.
← Read articleReady to calculate fair value?
Try BurryDCF free — see both GGM and dilution-aware valuations for any stock.